Read your results
Insights
Insights holds every measure for one brand on one scrolling page. It sets you against your rivals by AI model, topic, stage and location, and lists the sites the answers cite.
Open it
Pick Insights under Results in the brand's sidebar. The tiles and most card links on Overview land here too.
The page address keeps your window, filters and measure. A saved link reopens the same view.
Pick a time window
The row at the top stays in view as you scroll. It starts with the time window: 7D, 30D or 3M. Each counts back from the day of your latest run, and the page opens on 30D.
Custom opens a calendar with ready ranges, from Last 7 days to All time. A dot marks each day that holds a run. Pick a start day, then an end day.
The window sets the charts and every history card. The tiles always read the latest run inside it.
Compare with another period
Inside Custom, Compare with sets what every change on the page is read against.
| Choice | Each change compares the latest run with |
|---|---|
| Previous period | the latest run in the same number of days right before your window (the default) |
| Last month | the latest run in the same days one month back |
| Last year | the latest run in the same days a year back |
When that period holds no run, the change shows a dash, never a zero.
Filter the answers
Five filters follow the window: Topic, AI model, Location, Stage and Rival. Location shows only when the brand has locations, and Rival only once rivals exist.
Each menu takes several picks, and an answer counts when it matches any of them. Filters remove answers before any number is worked out. Clear all removes every filter.
The headline and the tiles
A sentence at the top says where you stand on the chosen measure. The line under it gives the number of answers behind it, your filters and the trend. When few answers sit behind the numbers, it warns you to read them with care.
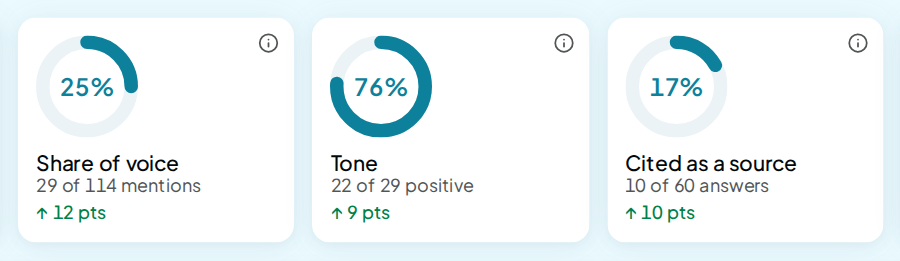
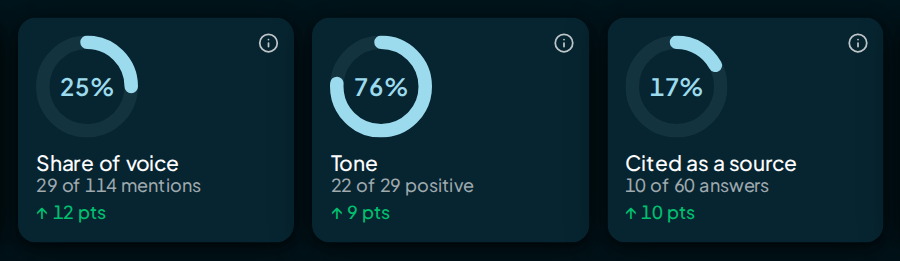
The five tiles are Visibility, Share of voice, Tone, Cited as a source and Position. Click one to switch the whole page to that measure. The glossary gives each formula.
The trend chart
The chart draws you against each named rival across the window. Switch its measure at the top left: Visibility, Tone, Position, Share or Cited.
D, W and M group the runs by day, week or month. A group holding several runs shows their plain average.
The Chart actions menu offers Export CSV, Save as image and Copy to clipboard. The CSV holds exactly what the chart draws.
The rivals board
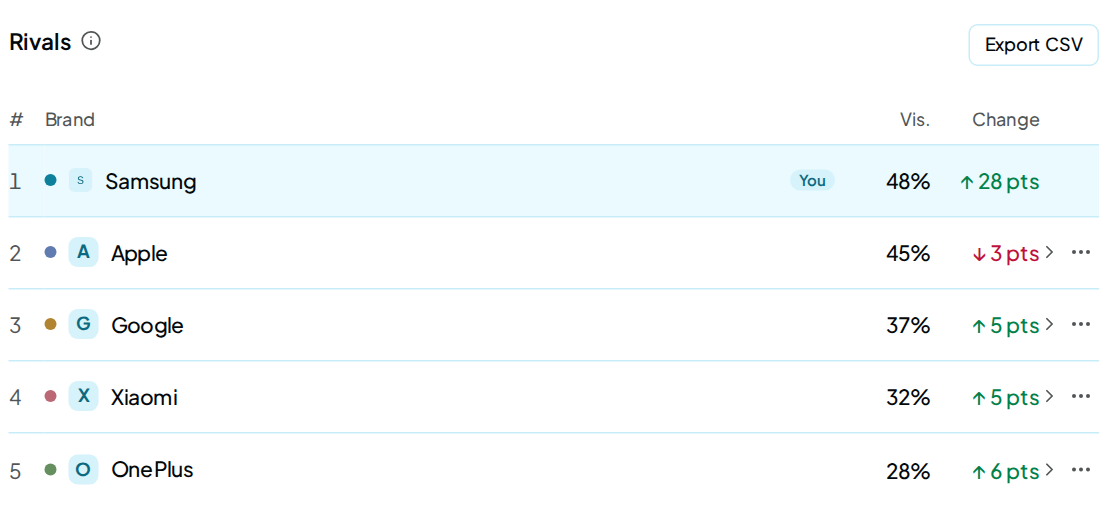
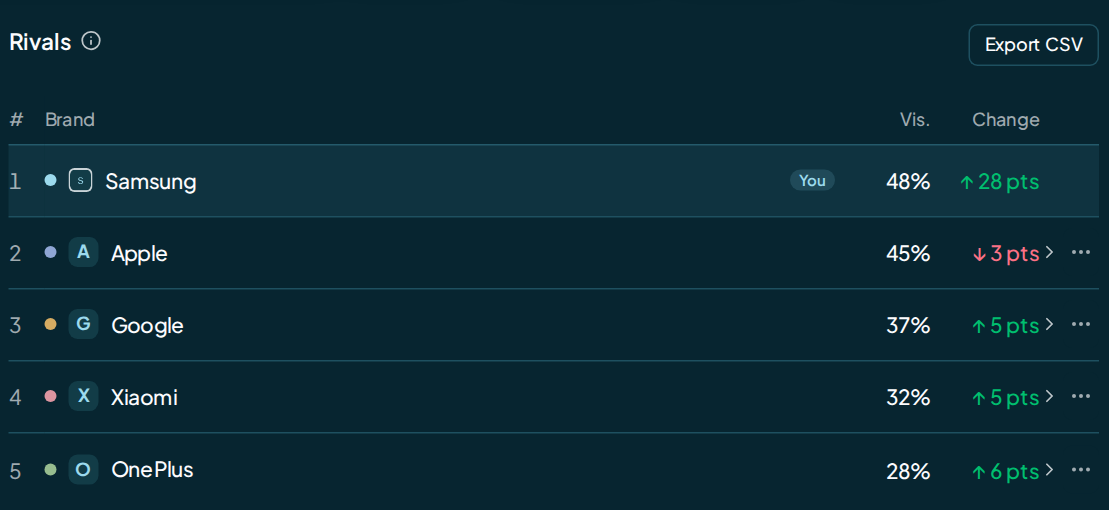
Rivals lists every brand named in the latest run's answers, you included, ordered by the chosen measure. Its columns are #, Brand, the measure and Change. On Cited, the measure column counts mentions instead.
On Position, a brand ranks only once 3 or more answers place it. Brands under that sit below a Too few answers to rank line, with their average and no rank. See Position.
| Action | What it does |
|---|---|
| Click a rival's row | Sets you against that rival on each prompt that named them: You ahead, Rival ahead or Rival alone |
| Compare with you | The same comparison, from the row's ⋯ menu |
| Ignore — not a real mention | Takes the brand off the board and out of every number |
| Ignored brands | Lists the brands you ignored, with a count; Restore puts one back |
| Export CSV | Downloads the board |
In the comparison, click a prompt to read its stored answer. Edit your rival list at the foot opens Brand settings › Rivals. See Rivals.
The performance matrix
The Performance matrix shows one measure across two dimensions of the latest run. It opens with brands down the side and topics across.
The axis picker swaps in AI model, Topic, Stage, Location or Brand. The matrix has its own measure switch, and Reset view brings back the starting layout.
Click a cell to filter the whole page to that row and column. A cell with fewer than 3 answers shows a dash.
Prompts, share and AI models
| Card | What it shows |
|---|---|
| Prompts by AI model | The latest run's 8 prompts that need the most work, your place on each AI model, and who was Named first |
| Share of voice | You and up to 4 rivals, as a ring |
| By AI model | Your chosen measure on each AI model you asked |
| By stage & tone | Your measure in each buying stage, and your tone against rivals |
The prompts card's footer link opens the full list on Prompts.
Sources
The sources section appears once the answers carry links. Its Sources card counts Times cited this run, Unique URLs and Unique domains, each with its change. A bar splits the links by kind of site, beside a map of the most-cited domains.
Sites the AI models cite lists the top 10 domains with URLs, Times cited and Share. Each one carries its kind: Yours, Rivals, Review sites, Directories, Maps & local, Social, Community or Other sites. Click a domain to see the pages cited on it.
Publishers to pursue lists directory, review, map, social and community sites from your sources that don't cite you yet. What changed sorts the cited pages into New, Up, Same, Down and Dropped against the comparison run. See Sources.
Export CSV
The three files, and what each holds
| Export | Where | What the file holds |
|---|---|---|
| The trend | Chart actions on the trend chart | Each period of the chart, its run count and every brand's value |
| The board | Export CSV on Rivals | Each brand, how many answers named it, its share and its change |
| The sources | Export CSV on Sources | Each URL the latest run cited, its domain, kind, count, the prompts that cited it, and the first and last day it was seen |
The board and sources files cover the whole brand. Your window and filters don't narrow them.
FAQ
Why does a change here differ from Overview?
Overview compares the latest run with the run before. Insights compares it with the latest run in the period you compare with. By default that is the same number of days right before your window.
Why does a cell show a dash?
Fewer than 3 answers sit behind it, or the measure has nothing to read there. A share worked out from 1 or 2 answers would mislead. Hover the dash to see which case it is.
I added a rival by hand. Why isn't it on the board?
The board lists the brands each run finds recommended in the answers, up to 25 per run. A rival you add in Brand settings joins the board once a run finds it there.
Does Insights use credit?
No. Insights reads your stored runs. Exports are free too.